This is Part 1 of an ongoing series where I work through the MITRE ATT&CK Evaluations APT29 dataset in Splunk. No vendor tools. No shortcuts. Just logs, SPL, and a methodology built over two years of self-teaching.
When I first ingested the APT29 Day 1 dataset into Splunk and saw 196,071 events staring back at me, my first reaction was honestly just: okay, where do I even start.
That number is not small. Somewhere inside it is a complete APT29 intrusion, one of the most documented and sophisticated threat actors in the world, linked to Russia’s SVR foreign intelligence service and responsible for the SolarWinds supply chain attack, the DNC breach, and a string of operations that ran undetected inside victim networks for months at a time. The dataset is based on a real adversary emulation exercise run by MITRE. The techniques are real. The logs are what an actual APT29-style intrusion looks like on the inside.
So the question is not how to search 196,071 events. The question is where to look first.
Over the past two years I’ve built one habit that has saved me more time than any tool or certification. Before I write a single SPL query I open the raw events and read. Not all of them, just a few dozen, randomly sampled. I want to understand what normal looks like in this dataset before I start searching for abnormal. What fields are populated. What the timestamps tell me about activity patterns. Which processes appear repeatedly. It sounds slow but it’s actually faster than searching blind because you stop chasing dead ends.
After a few minutes with the raw APT29 events I had enough of a picture to start: Sysmon logs, Windows Event Logs, a domain called DMEVALS, multiple machines. Now I had context.
The first real search I ran was simple:
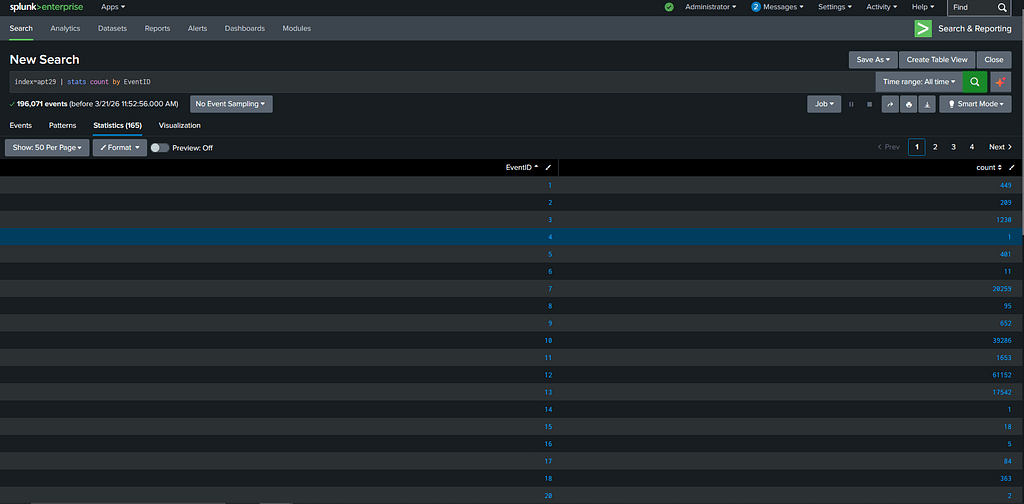
index=apt29 | stats count by EventID
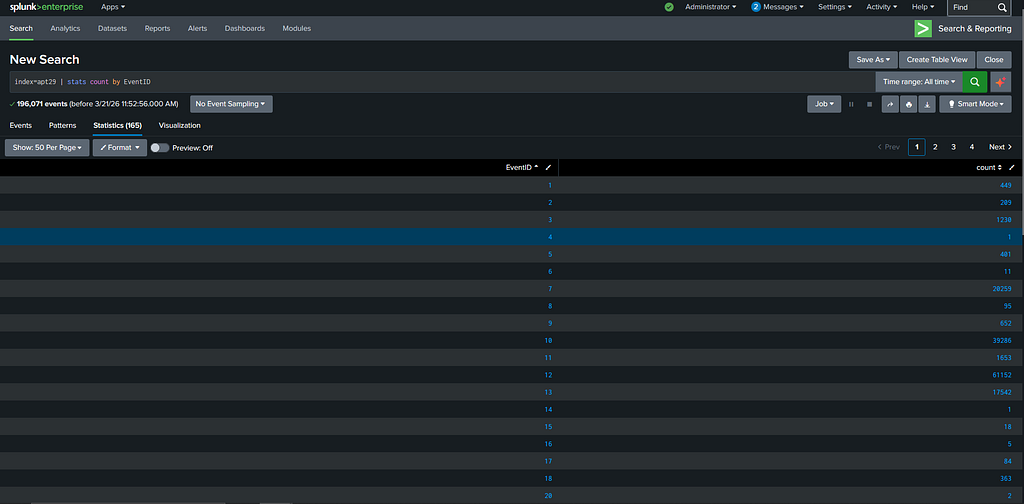
No filters. Just give me a breakdown of every EventID in the dataset and how many times each one appears. This took 165 seconds to run across the full 196,071 events and what came back was the most informative thing I saw all day.
EventID 1, process creation, had 449 events. EventID 10, which captures when one process accesses another process’s memory, had 39,286. EventID 12, registry object created or deleted, had 61,152. EventID 13, registry value set, had 17,542.
I want to sit with those numbers for a second because they tell you something important about how APT29 operates. Most detection tools and most detection engineers focus heavily on process creation. It is the obvious place to look. APT29 knows this. So they kept their process footprint small, 449 events for the entire day, while doing the bulk of their actual work in memory and the registry where far fewer eyes are pointed. Nearly 40,000 memory access events and nearly 79,000 registry events in a single day of simulated operation. That level of activity in those places is not normal and it is not accidental.
I still started with EventID 1 because 449 events is a manageable number and process creation tells you the execution story. The search I ran was:
index=apt29 EventID=1 | table _time, Message, ParentImage, Image, ParentCommandLine, User
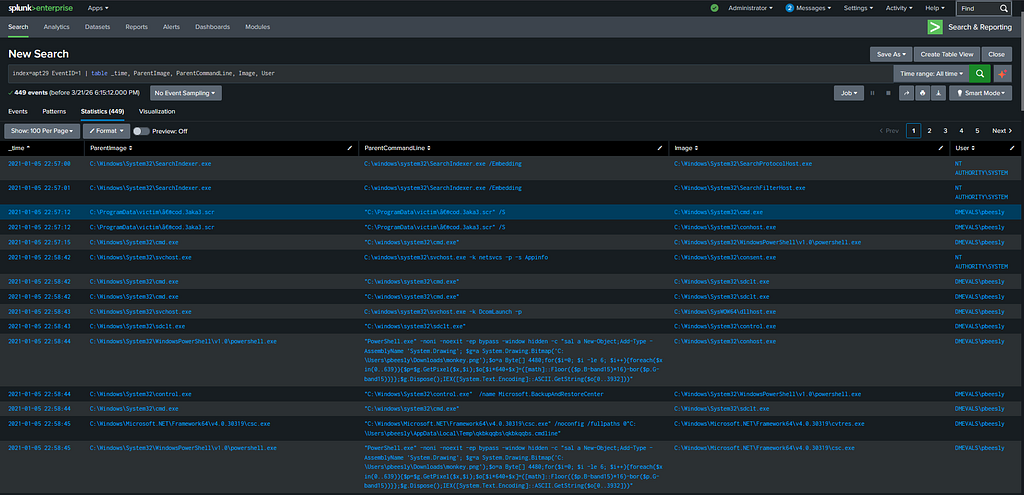
Scrolling through the results one username kept appearing across the suspicious entries: DMEVALSpbeesly. That is the victim account. Once you find the victim account in a dataset like this your search space collapses because you now have a subject to follow rather than a haystack to search.
The process creation logs under this account told a clear story. At 22:57:12 on January 5th 2021 a file called cod.3aka3.scr executed from C:ProgramDatavictim. A .scr extension is a screensaver file, which Windows treats as a legitimate executable. APT29 used it as their initial dropper, disguising the entry point as something that belongs on a Windows machine. Within three seconds of execution it spawned cmd.exe. Three seconds after that, powershell.exe appeared.
That three-hop chain in under ten seconds is not a person typing commands. That is automated execution moving as fast as the OS will allow.

At 22:58:44 something more interesting appeared in the logs. PowerShell was loading a PNG image called monkey.png from the Downloads folder but it was not displaying it. It was using System.Drawing.Bitmap to read the image pixel by pixel, extracting specific bits from each pixel’s colour values and assembling those bits into a byte array. That byte array was then converted into executable code and run directly in memory.
This is steganography. The actual APT29 implant was hidden inside the pixel data of a normal-looking image file. To any antivirus scanner monkey.png was just a picture with nothing to flag. The payload never existed as a file on disk. It was extracted from an image and executed entirely in memory, which is why traditional endpoint security did not catch it.
After the payload was extracted two more processes appeared: csc.exe, which is the C# compiler that ships with Microsoft’s .NET Framework, and cvtres.exe, the resource converter that accompanies it during compilation. APT29 used Microsoft’s own compiler to compile their extracted payload into executable code on the fly. These are signed Microsoft binaries. They blend into normal Windows activity completely and they bypass tools that rely on executable signatures or reputation scoring.
That covers what I found in EventID 1.
Everything above came from 449 process creation events out of 196,071 total. The remaining EventIDs are still open. The 1,230 network connection events in EventID 3 will tell me where the implant called out to and what the C2 beaconing pattern looked like. The 39,286 memory access events in EventID 10 will tell me how credentials were harvested. The 95 CreateRemoteThread events in EventID 8 will show me exactly which processes APT29 injected into to stay hidden.
And late in the Day 1 timeline the logs show activity shifting to a second user account on the DMEVALS domain. APT29 moved laterally. Where they went, which machines they hit, and how they authenticated after harvesting credentials is what the remaining EventIDs will show. That is what Part 2 covers.
449 process creation events in a dataset of 196,071. APT29 was nearly invisible at the layer most defenders watch. The rest of the evidence was in the 195,622 events I haven’t finished yet.
Part 2 covers the network connections, memory access events, lateral movement, and the second user account. Plus the first detection rules built from what I found here. Publishing next week. All findings are from the publicly available MITRE ATT&CK Evaluations APT29 dataset at github.com/OTRF/Security-Datasets. Tools used: Splunk Free tier.
The interesting part isn’t just the attack,it’s how to catch it.
I’ll be publishing the detection logic and Sigma rule for this on Substack.
Originally published at https://open.substack.com.
Hunting APT29 in 196,071 Logs: What I Found in EventID 1 was originally published in OSINT Team on Medium, where people are continuing the conversation by highlighting and responding to this story.